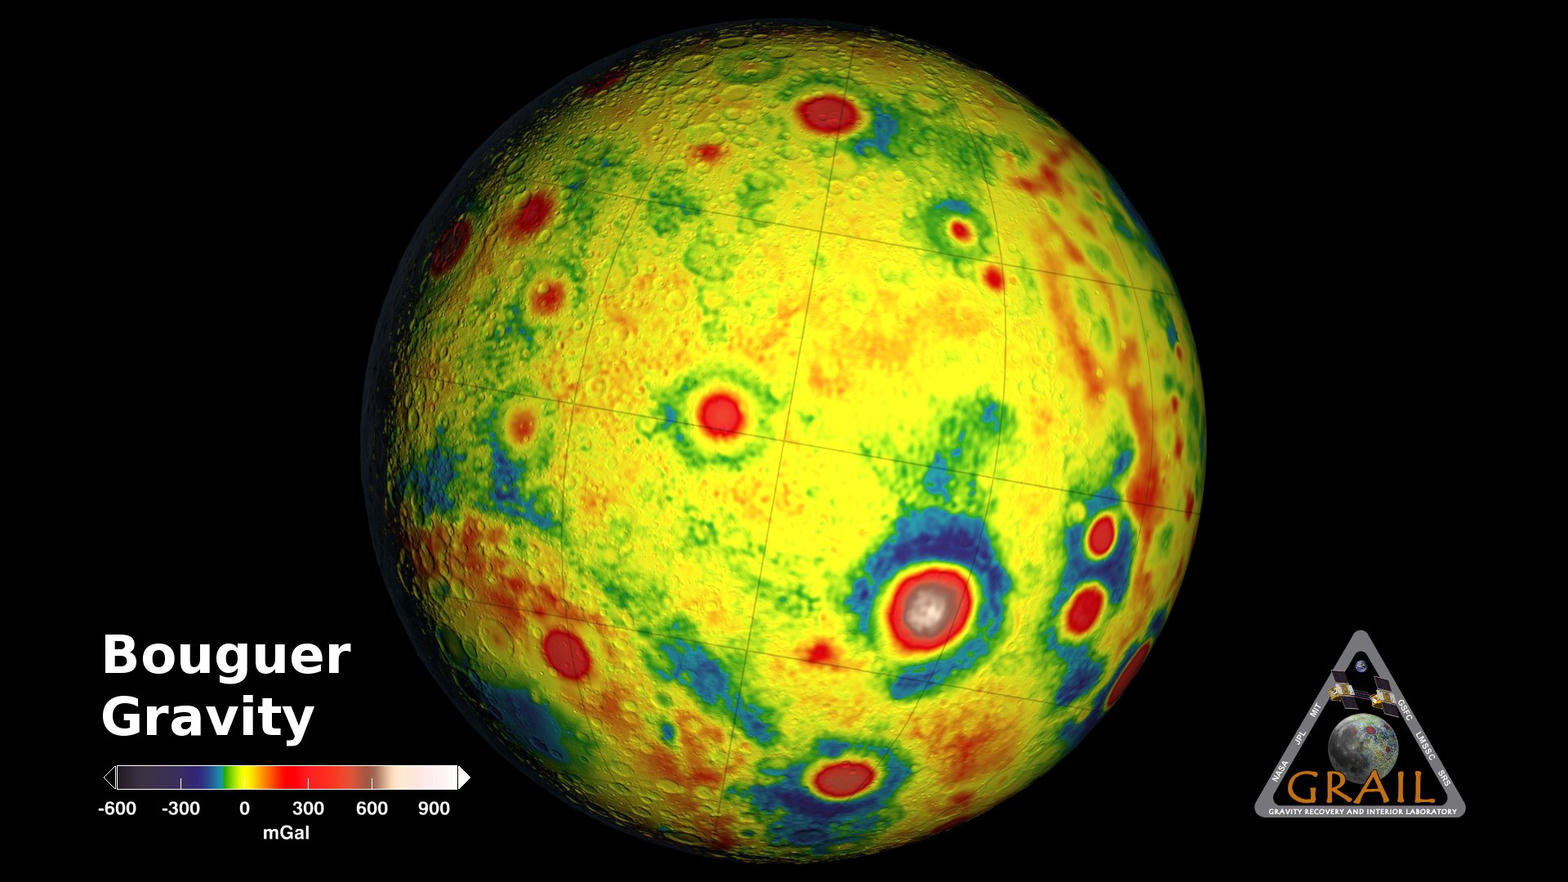
GRAIL is a finished mission. Its gravity field is not. Fifteen years after launch, the maps from NASA's Gravity Recovery and Interior Laboratory remain the highest-resolution look inside the Moon — a portrait of mass concentrations, a thinner crust than many models assumed, and a far side that cameras had always shown as battered, but never weighed so carefully.
The spacecraft were GRAIL-A and GRAIL-B, later renamed Ebb and Flow by fourth-graders in Bozeman, Montana. They launched together on a Delta II from Cape Canaveral Air Force Station on September 10, 2011 at 13:08:52 UT. What looks like abstract art in their gravity maps is a scientific product: red marks stronger pull, blue weaker. Mascons — dense mass concentrations — sit as bull's-eyes that no optical camera can see.
01Twin spacecraft, one idea borrowed from Earth
The method was a lunar version of NASA's GRACE mission at Earth. Ebb and Flow flew in formation. As they passed over denser or lighter regions, they drifted slightly toward or away from each other. The Lunar Gravity Ranging System recorded those tiny changes in distance with microwave ranging. The science instrument was, in a real sense, the pair itself.
They reached lunar orbit a day apart at the turn of 2011–2012 (Ebb on December 31, Flow on January 1). Science mapping began in March 2012 from an average altitude of about 55 kilometers. The prime mission ran three lunar mapping cycles; an extended campaign dropped the orbit still lower, sharpening basins such as Orientale. Combined with Lunar Reconnaissance Orbiter topography, the field still feeds orbit determination and landing-site work.
They also carried MoonKAM cameras so students could request images — an education payload tied to Sally Ride's foundation. On December 17, 2012 both probes were deliberately crashed near the lunar north pole. The impact site was later named for Ride.
GRAIL never needed a pretty postcard of the surface. Its defining measurement was the changing distance between two spacecraft — a gravity field inferred from motion, not from light.
02What the maps actually showed
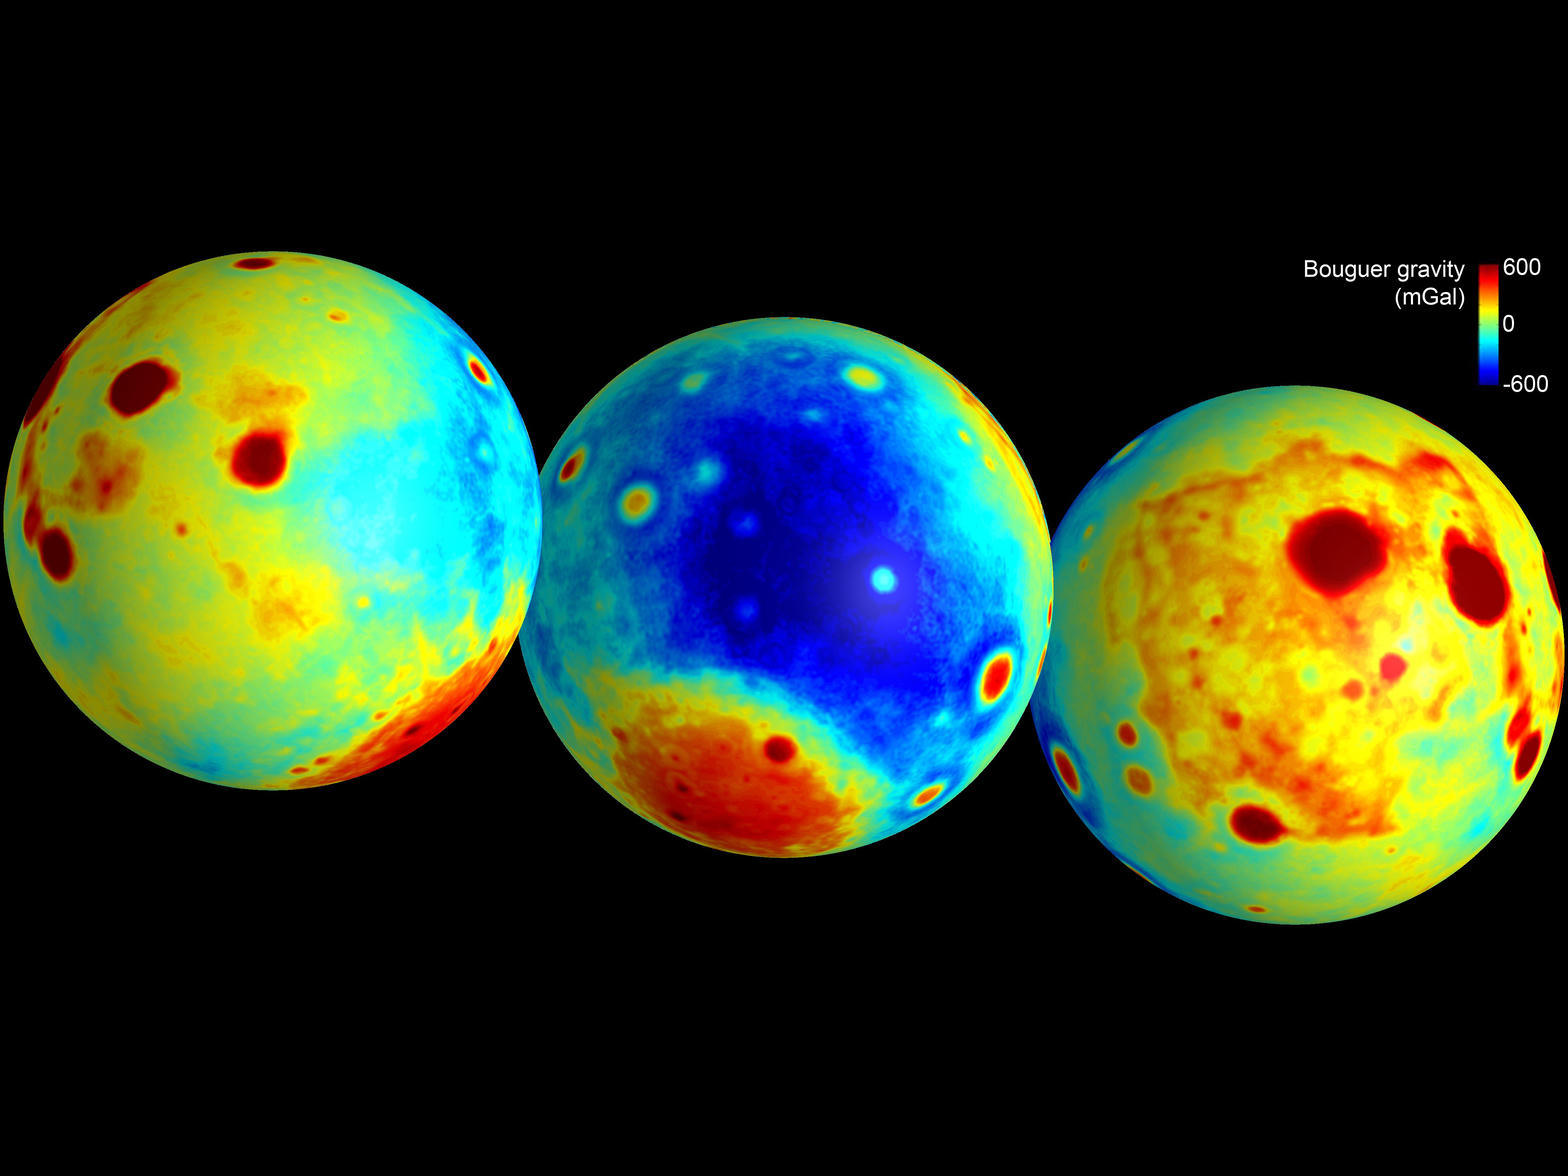
Mascons had been known since 1968, but their origin was fuzzy. GRAIL data plus impact models showed they formed when large asteroids or comets struck a still-hot early Moon. Light crust and dense mantle mixed with shock, leaving the bull's-eye gravity signatures we still see. The same class of features exists on Mars and Mercury; the Moon became the calibration case.
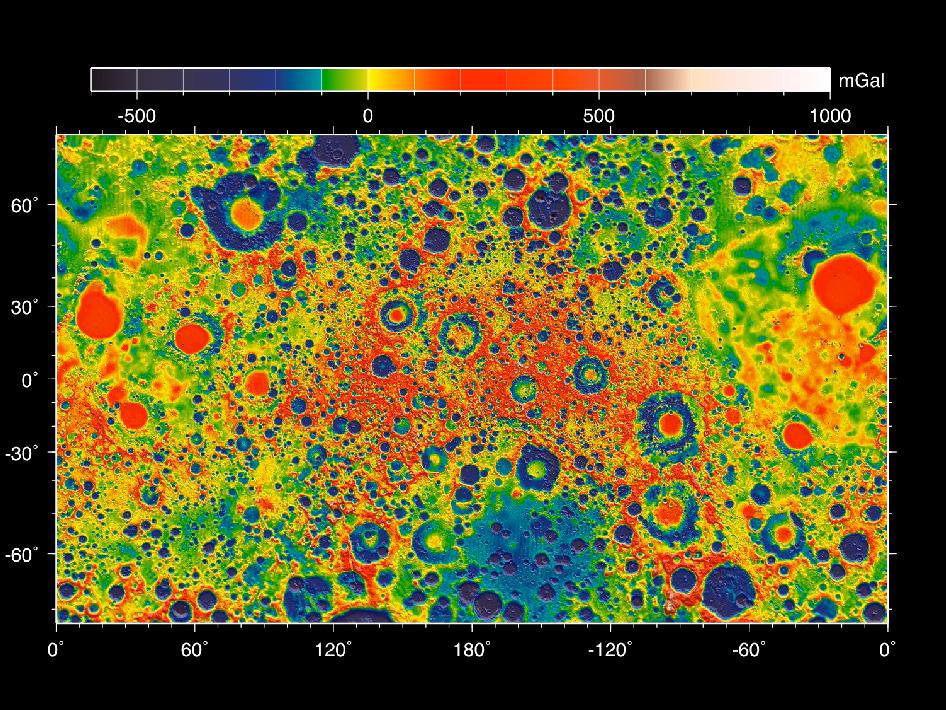
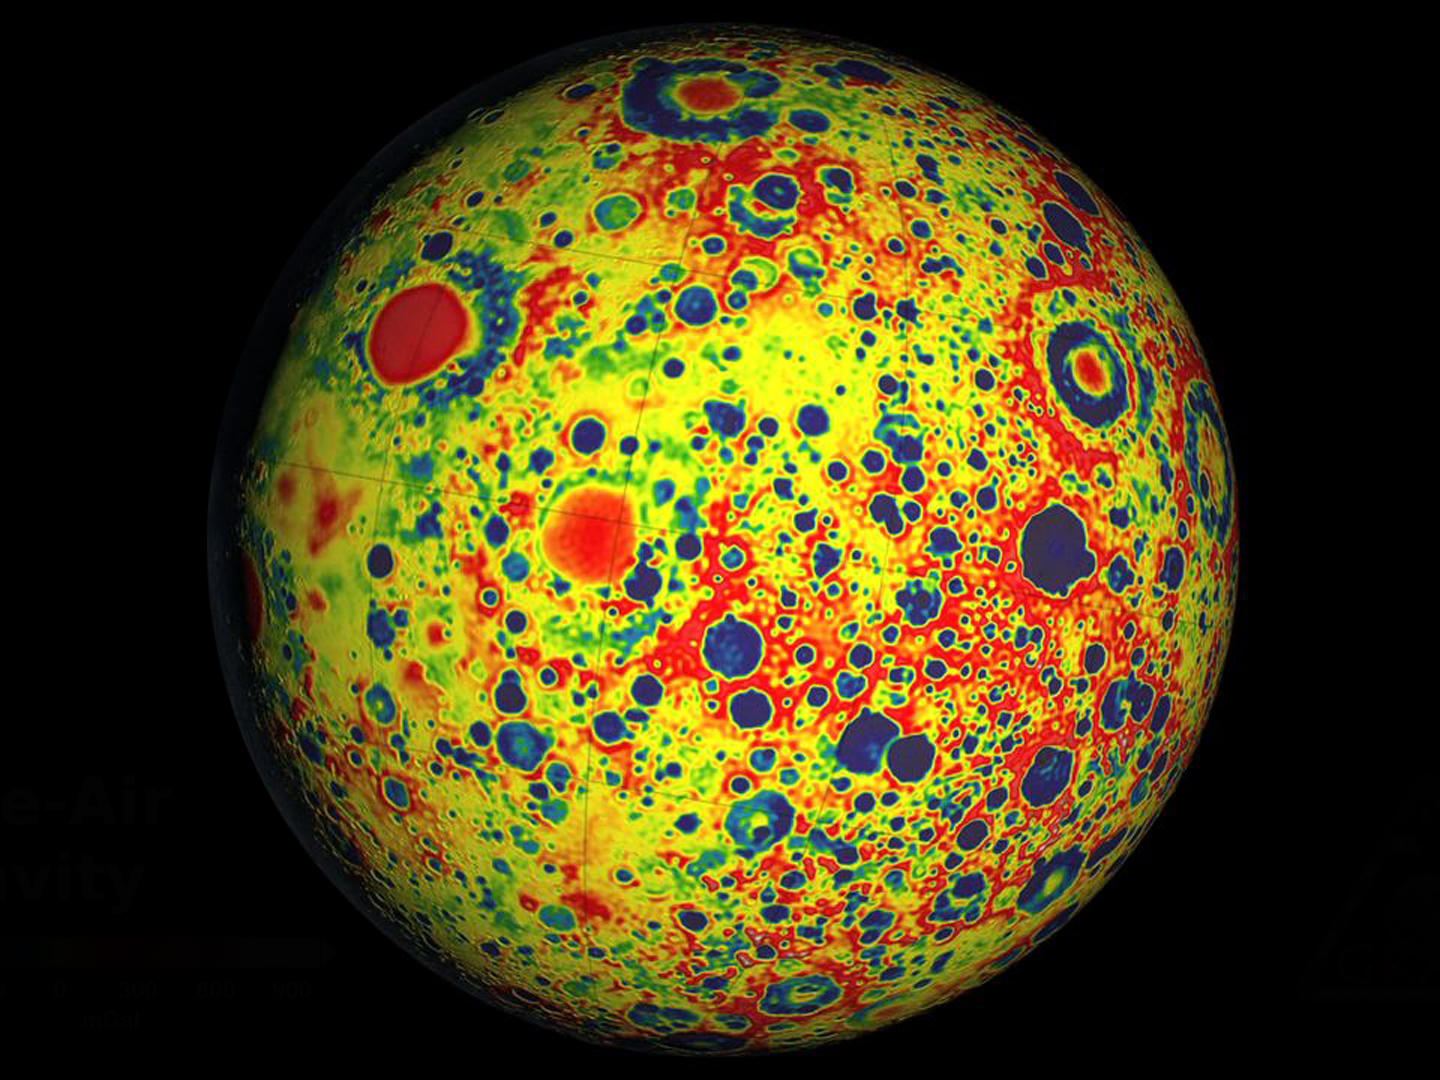
The maps also showed a thinner, more fractured crust than many earlier models assumed: analyses led by Mark Wieczorek and colleagues put the average thickness near 34–43 kilometers, and in a few basins the crust is effectively gone. Linear gravity anomalies were interpreted as ancient dikes from a magma ocean. Far-side detail that earlier missions could not resolve as cleanly became readable, because the far side is more heavily cratered and had been harder to weigh from Earth.
Resolution during the primary campaign reached features on the order of tens of kilometers across; later low-altitude passes sharpened the largest basins further.
03Why it still matters in 2026
South-polar gravity and crustal-thickness maps inform Artemis landing-site studies and the search for mantle material excavated by the South Pole–Aitken impact. Commercial landers and future human missions still fly through a gravity field that Ebb and Flow measured first at this fidelity.
September 10 is an anniversary of a launch, not of a conclusion. The useful lunar science here never required a camera pointed at the surface — only two spacecraft talking to each other, and an archive that later missions still open.
PRIMARY SOURCES
Sources, dates, and image use
- NASA Science. GRAIL (Ebb and Flow). Launch time, orbit insertion, impact date, mascon interpretation, MoonKAM. Accessed August 26, 2026.
- NASA JPL. Gravity Recovery and Interior Laboratory (GRAIL). Mission archive.
- Zuber, Maria T., et al. Gravity Recovery and Interior Laboratory (GRAIL): Mapping the Lunar Interior from Crust to Core. Space Science Reviews 178 (2013): 3–24.
- Wieczorek, Mark A., et al. GRAIL crustal-thickness results as summarized in contemporary mission explainers (average crust ~34–43 km).
Editorial methodology: this piece is adapted from an Apeira Astra draft assembled around NASA's GRAIL anniversary materials. Facts were checked against NASA Science and JPL pages on August 26, 2026. NASA imagery is public-domain science product used with source acknowledgement. Apeira Astra is independent and is not affiliated with, sponsored by, or endorsed by NASA.